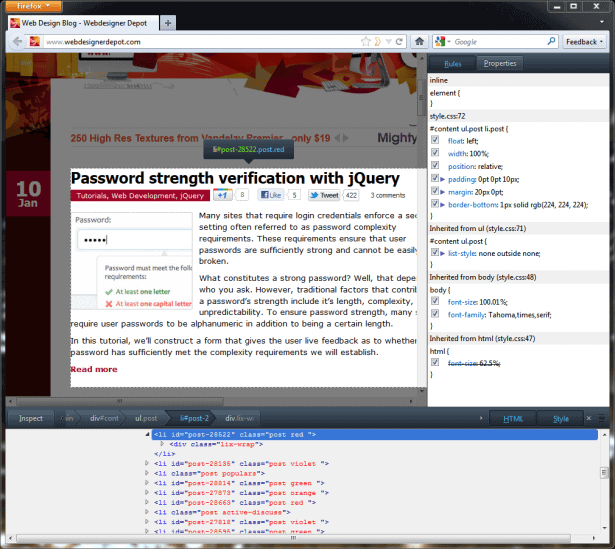
Firefox 10, due out January 31st (the same day Firefox 11 becomes an official Beta release), finally rounds out the browser’s growing collection of developer tools with Page and Style Inspectors.
In some ways, these tools are similar to Firebug, but they’re also uniquely Mozilla-ey.
Rather than try to reproduce Firebug or the WebKit developer tools, Mozilla has included only the most essential features, focusing instead on making the experience elegant.
Does the new approach work, or will designers run screaming back to Firebug? Let’s take a look.
You can pull up the Page Inspector by right-clicking a web page and choosing “Inspect.” (Firebug recently changed its context menu item to read “Inspect in Firebug,” so it will coexist peacefully with the built-in dev tools.) At the bottom of the screen, a purple bar appears with a list of the selected element’s parents and children.
You can click parents or children to select them, and you can right-click an element to see its siblings. There are also buttons labeled “Inspect,” “HTML,” and “Style.” If Firebug’s sea of tabs and buttons drove you up the wall, this layout will be a godsend. If just you want to see the DOM, having to click “HTML” first may drive you up the wall.
Digging in
Clicking the HTML button bring up a panel that shows the hierarchy of HTML tags that make up your page. In this view, you can expand and collapse tags and edit their attributes. Clicking the “Inspect” button lets you hover over elements to inspect them, and as you do so, Firefox highlights the element you’re inspecting and darkens the rest of the page.
Clicking the “Style” button brings up the Style Inspector, showing the CSS rules that apply to the selected element. In the Style Inspector, you can switch from “Rules” to a “Properties” section that gives you the computed CSS properties for the selected element, along with links to Mozilla’s documentation for each property.
The Style Inspector sits to the right of the page, while the Page inspector and HTML pane sit at the bottom of the screen. You can choose to display both panes, just one of them, or neither.
That basically covers the entirety of what the Page and Style Inspectors do. The web console and JavaScript scratchpad, introduced in earlier versions of Firefox, are separate tools. There is no network activity monitor. There’s no user agent switcher, no “edit as HTML feature,” no performance-testing tools, no way to inject new tags into a page, no way to activate an element’s hover state. There’s not even a “layout” panel for viewing the dimensions, padding, and margins of your element.
Despite all those limitations, I keep coming back to the Page and Style Inspectors. I come back for the uncluttered interface, the thoughtfully placed panes, and that funky purple chrome. I come back because they’re a pleasure to use, and because they meet my needs most of the time.
The inspectors’ simple UI also means that they’re useful even when I’ve made the window small to test responsive designs. When they don’t meet my needs, I just open Firebug or the Web Developer Toolbar. (I’d do this a lot less if the built-in dev tools had equivalents to Firebug’s Layout and Net panels.)
Mozilla’s development tools don’t have to match the feature set of their competitors’ tools, because the specialized features of those tools already exist as Firefox extensions. That’s what makes the Firefox dev tools unique.
These browsers go up to 11
In addition to the HTML and Style Inspector, some innovative features are slated for later releases of Firefox. Firefox 11’s developer tools let you view your web page as three-dimensional stacks of tags. Each time you nest a tag, that stack of tags gets taller. This feature is actually surprisingly helpful—you can see at a glance whether an element is inside the wrong parent, and seeing those tags pile up will cure new developers of div-itis right quick.
Also due out in Firefox 11 is a style editor. This is tool lets you create new stylesheets, much like any good text editor would. The main difference is that your changes are applied to live web pages as soon as you finish typing.
Previously, this sort of live CSS editing has been the domain of development environments like Espresso, so it’s awesome to see this feature built right into the browser. More features, including “tooling to assist with application performance issues,” are planned for later this year.
Even in Firefox 11, though, comparing the built-in dev tools with Firebug (or with the WebKit dev tools) is a little like comparing iOS with Android. The former has a clean, intuitive UI and some innovative ideas, but it’s short on power user features.
The latter has every feature that you can think of, and you can configure the blazes out if it, but it’s not quite as elegant as Cupertino’s wunderkind. Unlike iOS and Android, it’s easy to use both tools at the same time if you want. Mozilla continues to contribute to Firebug and has made it clear that Firebug is here for the long haul.
Which tool is right for you? That depends on what features you need, what features you can live without, and how you feel about hunting down extensions to fill in the gaps in your tool of choice. Whatever you think about the new developer tools, this is one area where you can’t accuse Firefox of aping WebKit.
Are you excited about the new dev tools in Firefox 10? What are your go-to dev tools? Let us know in the comments!
